How to Do a Kinematic Analysis of a Rock Slope
Kinematic analysis asks whether a rock slope can fail at all, given the joints you mapped on it. It is the first screen run on every face-mapping dataset, and it takes one stereonet per failure mode. This is what each test checks, how to read the curves, and where screens go wrong.
Updated
What a kinematic analysis does, and what it does not
A block of rock can only move if the discontinuities around it let it out. Kinematic analysis tests exactly that, and nothing more. For each classic failure mode it draws the region of a stereonet where a joint, or the line where two joints intersect, would have to plot for that failure to be geometrically possible. Then it counts how many of your measurements land there.
It is not a factor of safety. It ignores water pressure, cohesion, block size, persistence and blasting damage. A critical result means a mechanism exists and deserves a stability calculation. A clean result means that mechanism has nothing to work with on the joints you measured. Both are worth knowing before anyone opens a limit-equilibrium program.
The three inputs, and the one that is a judgement
Every test below is built from three numbers. The worked example throughout is a cut face dipping 60° towards 135°, screened at φ = 35° with ±20° lateral limits, against 19 mapped joints in five sets.
- The slope face — its dip direction and dip, written 135/60. Every test is relative to it.
- The friction angle φ — of the discontinuity surfaces, not of the intact rock. Clean planar joints are usually 30–35°; rough ones can reach 40° or more; clay-coated or slickensided surfaces can be under 20°.
- The lateral limits — how far a joint may strike off the face and still be free to slide out. ±20° is the common convention, following Wyllie and Mah. It is a rule of thumb, not a law.
φ is the number to argue about
The face orientation and the joints are measurements. The friction angle is an estimate, and it moves every boundary on the net. Run the screen at the value you can defend, then again 5° lower, and report both if the counts change.
Planar sliding: three conditions, three curves
A single joint can slide out of a face when three things are true at once. Each one is a curve on the pole plot, and a pole is critical only if it satisfies all three.
- It daylights. The joint must be flatter than the face, measured in the joint's own dip direction, so that its down-dip line exits the slope rather than running into it. On the net this is the daylight envelope, a lens-shaped curve on the side opposite the face.
- It is steeper than φ. Otherwise friction holds the block. Since a pole sits as far from the centre as its plane dips, this is the pole friction cone: a circle of radius φ around the centre. Critical poles lie outside it.
- It strikes close to the face. The dip direction must be within the lateral limits of the face's, so the block is not pinned at one end. These are two straight lines from the centre, ±20° either side.
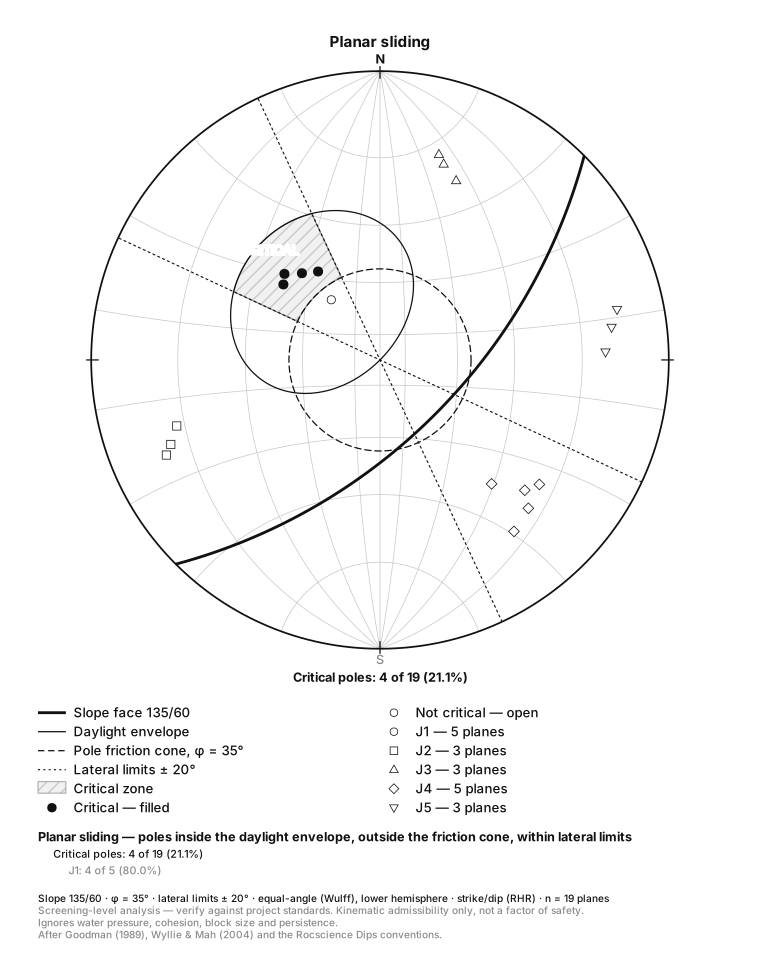
That fifth J1 joint is the reason the method is worth doing properly. It dips out of the face at the right angle and would look alarming in the field, but at 30° it is flatter than the friction angle. Daylighting alone is not failure.
Wedge sliding: where planar screens go wrong
A wedge is a block cut out by two joints, sliding along their line of intersection. So the test is run on intersections, not poles. Every pair of planes in the dataset gives one, which is why 19 joints produce 171 of them.
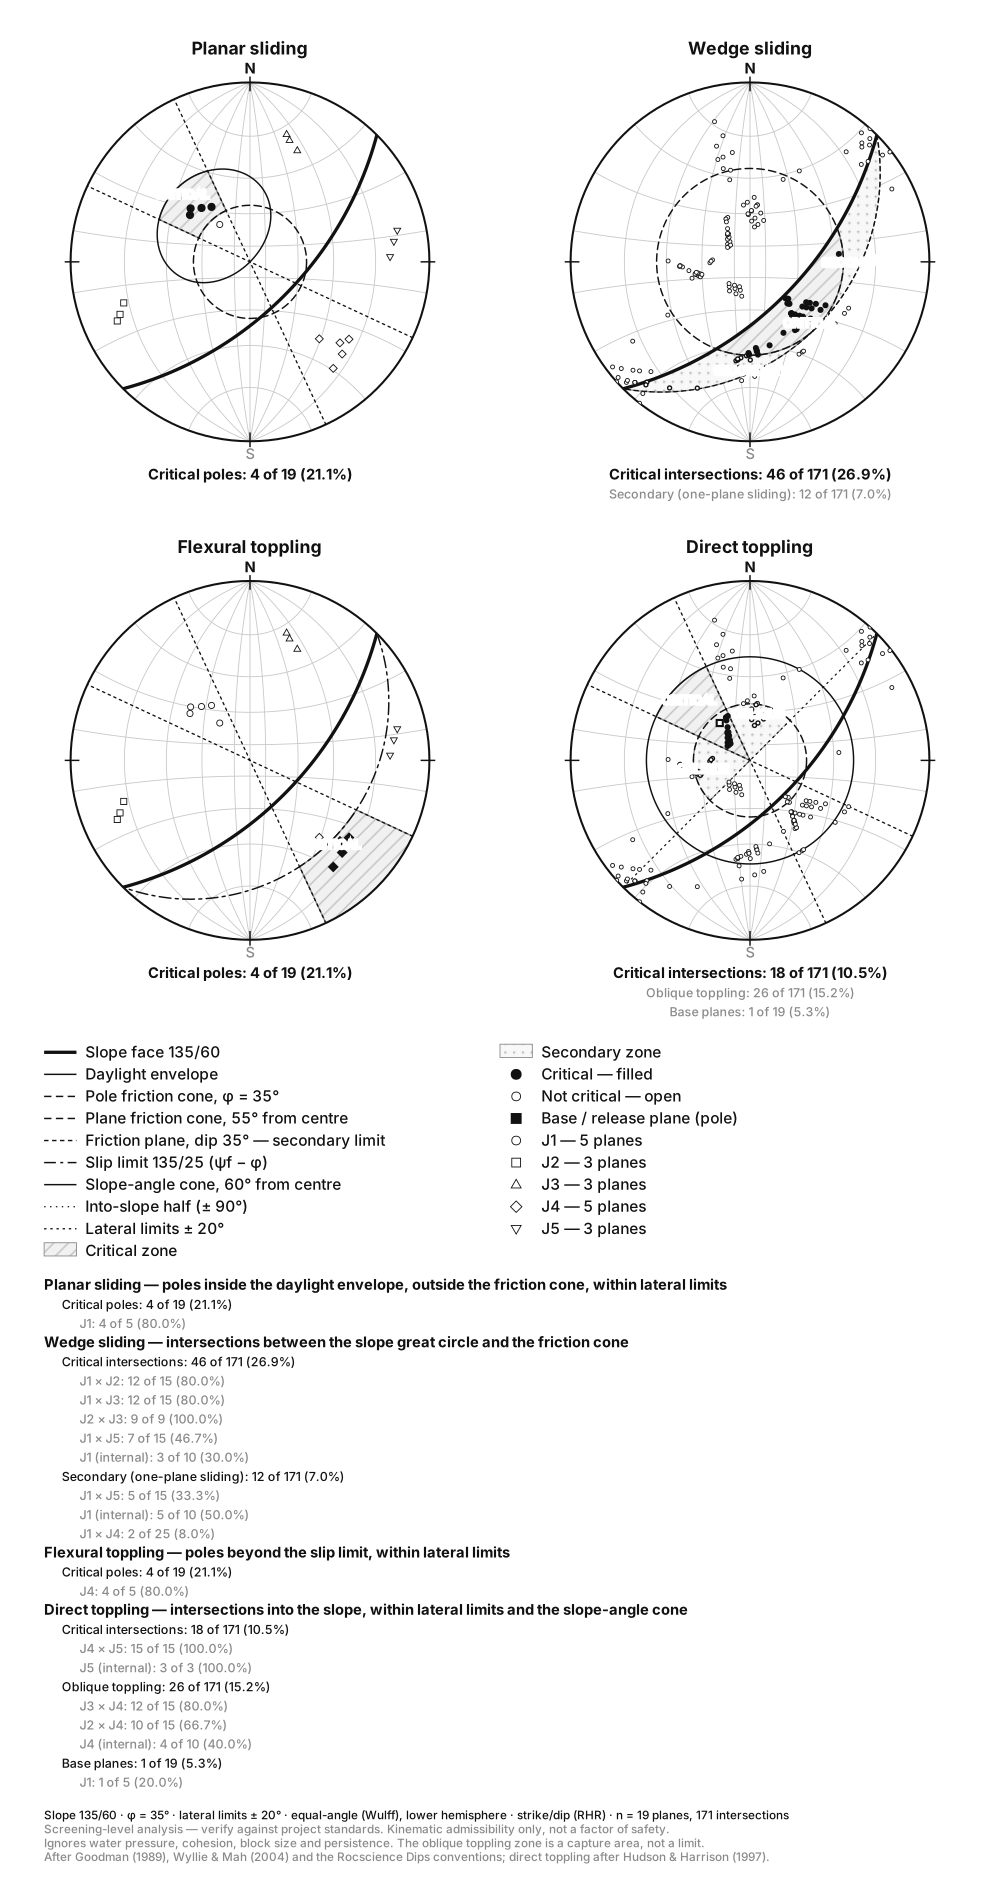
An intersection is critical when it plunges more steeply than φ but less steeply than the face along the same trend. That second limit is the apparent dip of the face, not its true dip: an intersection trending obliquely to the face has less rock to come out of. On the net the critical zone is the crescent between the slope's great circle and the friction cone. This is the construction usually called the Markland test.
Wedges get no lateral limits. The second plane gives the block an extra degree of freedom, so it can slide out obliquely. That is exactly why wedges catch out slopes that look safe.
In the example, joint sets J2 (about 070/76) and J3 (about 199/71) each pass the planar check easily. Both are too far off the face to daylight. Yet their intersection plunges about 54° towards 138°: steeper than 35°, flatter than the face. All nine J2 × J3 pairs are critical wedges. Two sets that are harmless on their own form a mechanism together.
Toppling: flexural and direct
Flexural toppling happens when steep joints dip into the face and the slabs between them bend forward. That needs the layers to slip past each other, which Goodman and Bray showed requires the joint to dip more steeply than 90 + φ − ψf, where ψf is the face dip. Here that is 90 + 35 − 60 = 65°. On the net this boundary is the slip limit, a great circle dipping 25° towards 135°. Critical poles lie beyond it, within the lateral limits. Four of the five J4 joints, dipping about 70° into the face, are critical. The fifth dips 60° and is not.
Direct toppling needs blocks: two steep sets whose intersection leans into the slope, standing on a shallow base plane. Sets J4 and J5 do nothing alarming separately, but all 15 of their intersections lean into the cut inside the lateral limits, and the 141/30 joint from J1 is shallow enough to act as the base. The net also shades an oblique toppling zone either side. It is a capture area for blocks that may rotate sideways, not a strict limit.
Reading all four modes together
| Mode | Tested on | Critical | Driven by |
|---|---|---|---|
| Planar sliding | 19 poles | 4 (21%) | J1 |
| Wedge sliding | 171 intersections | 46 (27%) | J1, and J2 × J3 |
| Flexural toppling | 19 poles | 4 (21%) | J4 |
| Direct toppling | 171 intersections | 18 (11%) | J4 × J5 |
The percentages say how much of your data plots in a zone. They are not a probability of failure. What matters is which sets are critical, because the next step is a stability check on those sets: a planar or wedge factor of safety, with water and support included.
Common mistakes
- Using the intact rock's friction angle. Joints are weaker than the rock between them. A φ from triaxial tests on intact core will clear slopes that are not clear.
- Stopping after the planar check. The example passes for J2 and J3 and fails as a wedge. Always run all four modes.
- Applying lateral limits to wedges. It removes exactly the oblique wedges the test exists to find.
- Getting the strike convention wrong. Right-hand-rule strike and dip direction differ by 90°. Read with the wrong convention, the whole dataset rotates a quarter turn and the counts change, but the plot still looks plausible.
- Treating the face as one orientation when it is not. A curved cut or a bench with a different batter is a different analysis. Split the face map and screen each domain separately.
Keep reading
- How to Read a Stereonet
Stereonets explained: equal-area vs equal-angle projection, great circles vs poles, density contouring, and what a girdle of poles tells you about a fold.
- Rose Diagrams for Structural Data
When to mirror a rose diagram and when mirroring is wrong, how to choose a bin width, and why petal radius should scale with the square root of frequency.