Guides
How to read the diagrams, not how to use the software. Each guide explains one plot properly — what the axes mean, what the patterns mean, and the mistakes that produce a figure which looks right and is not. The figures in them are the tools’ own output on real data.
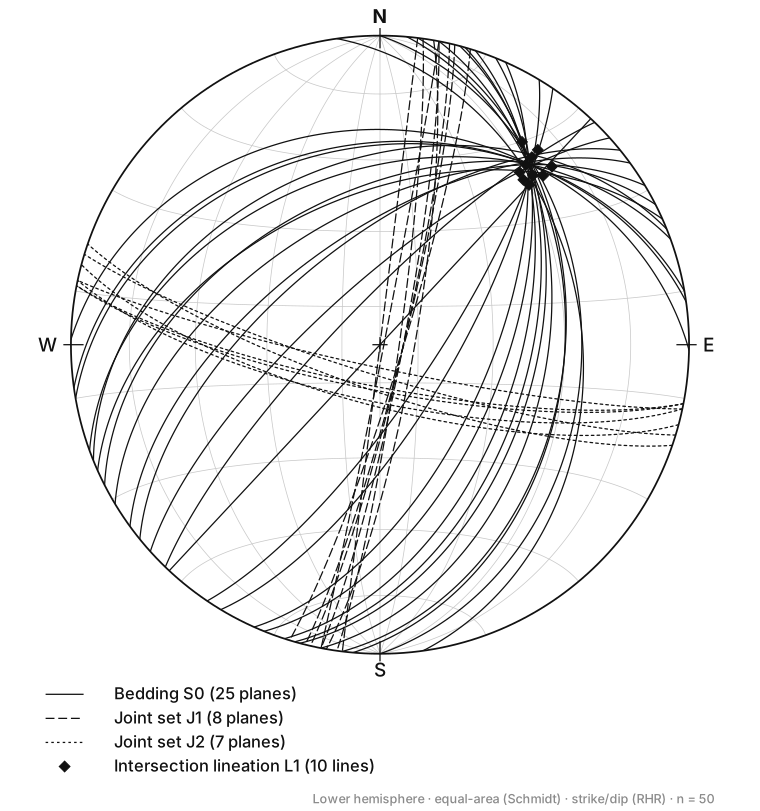
How to Read a Stereonet
Stereonets explained: equal-area vs equal-angle projection, great circles vs poles, density contouring, and what a girdle of poles tells you about a fold.
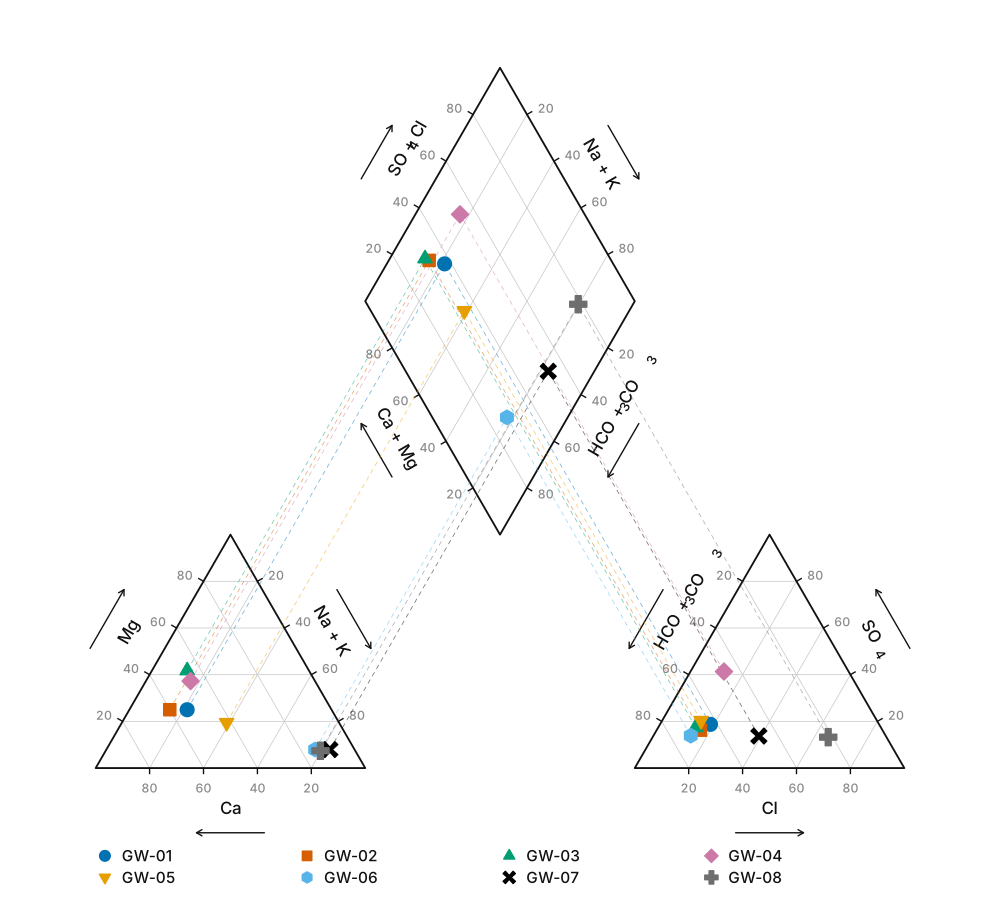
How to Read a Piper Diagram
The three panels of a Piper trilinear diagram explained, why concentrations must be converted to milliequivalent percentages, and a worked example classifying a real analysis.
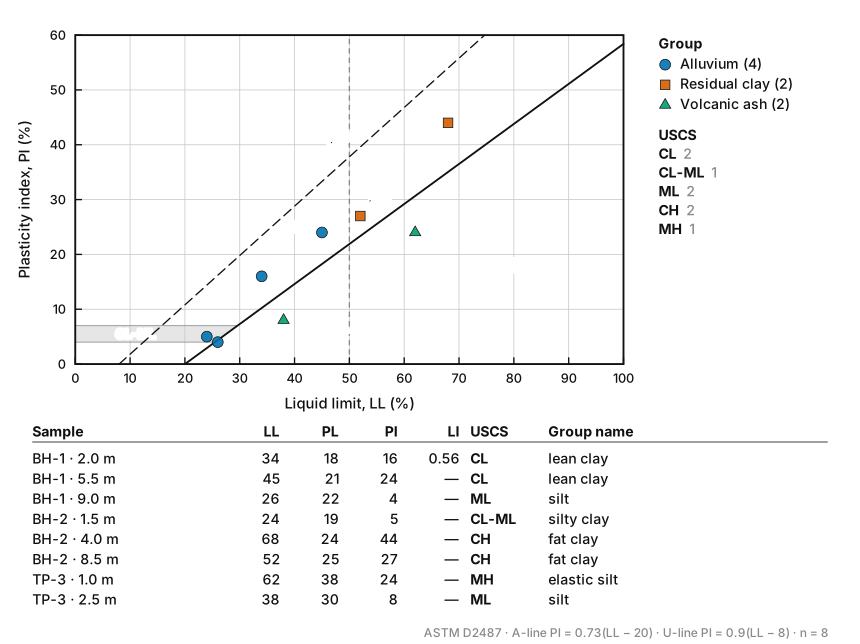
USCS Soil Classification Explained
The Unified Soil Classification System worked end to end: the group symbols, the decision path with its threshold numbers, when a dual symbol is required, and what the plasticity chart decides.
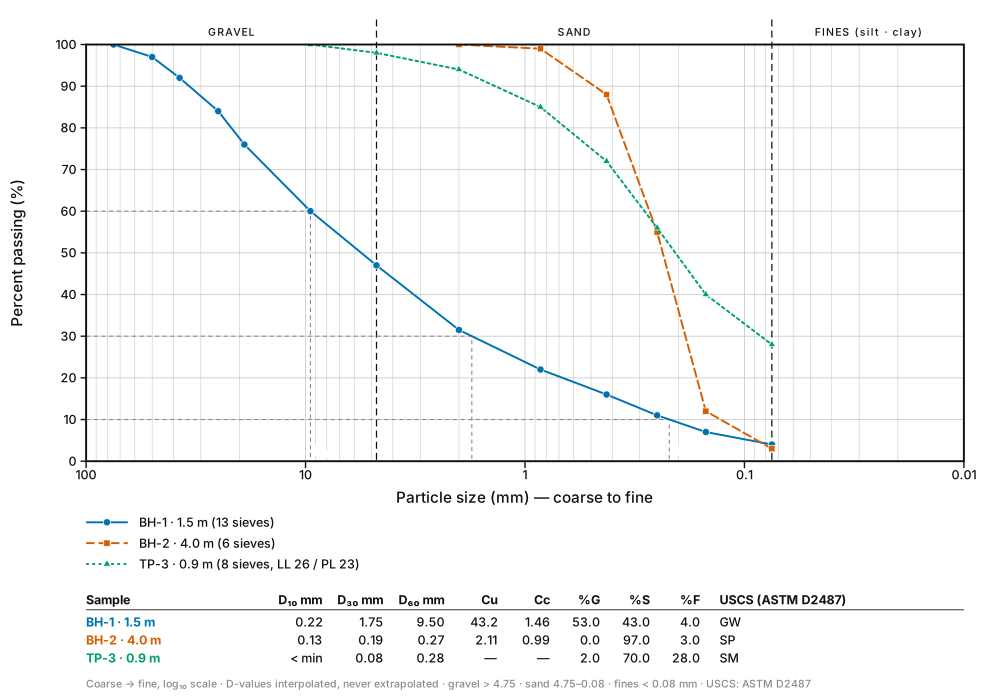
Reading a Grain Size Distribution Curve
How to read D10, D30 and D60 off a particle size distribution curve, calculate Cu and Cc with worked numbers, and tell a well-graded soil from a poorly graded one.
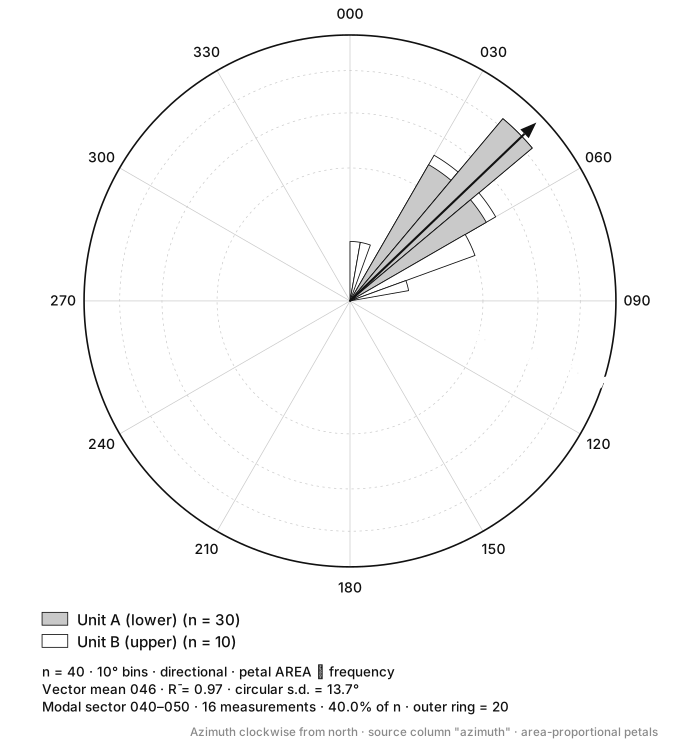
Rose Diagrams for Structural Data
When to mirror a rose diagram and when mirroring is wrong, how to choose a bin width, and why petal radius should scale with the square root of frequency.
Every guide is written against a tool on this site, and every tool is free to use with no account and nothing uploaded.
See all the plots