USCS Soil Classification Explained
The USCS turns a sieve analysis and a pair of Atterberg limits into a two-letter symbol that predicts how a soil will behave. This is the decision path, the numbers that sit at each branch, and three real specimens carried through it.
Updated
What the symbol is for
The Unified Soil Classification System, standardised as ASTM D2487, names a soil in a way that predicts its engineering behaviour rather than describing its appearance. "Brown sandy material" tells the next engineer nothing. SP tells them it is a poorly graded sand: it drains freely, compacts to a mediocre density, holds no cohesion in a trench face, and makes a poor structural fill but a good drainage layer.
A group symbol is one or two letters from a small vocabulary — the first names the dominant fraction, the second qualifies it:
| Letter | Meaning | Position |
|---|---|---|
| G | Gravel | First, coarse soils |
| S | Sand | First, coarse soils |
| M | Silt — non-plastic or low-plasticity fines | Either |
| C | Clay — plastic fines | Either |
| O | Organic | First, fine soils |
| W | Well graded | Second, coarse soils |
| P | Poorly graded | Second, coarse soils |
| L | Low plasticity — liquid limit under 50 | Second, fine soils |
| H | High plasticity — liquid limit 50 or more | Second, fine soils |
| Pt | Peat and highly organic soils | Alone |
Combining them gives the fifteen groups: GW, GP, GM, GC for gravels, SW, SP, SM, SC for sands, ML, CL, OL for low-plasticity fines, MH, CH, OH for high-plasticity fines, and PT for peat.
The decision path
Classification is a sequence of yes/no branches with hard numbers at each one. Two laboratory results feed it: a grain size distribution and, if there are enough fines to matter, the Atterberg limits.
- Coarse or fine? Take the percentage passing the No. 200 sieve (0.075 mm). More than 50% passing means a fine-grained soil, and the path jumps to step 5. Otherwise it is coarse-grained.
- Gravel or sand? Of the material coarser than 0.075 mm, does more than half sit above the No. 4 sieve (4.75 mm)? If so the first letter is G; otherwise S.
- How much fines? Under 5%, the second letter comes from gradation alone. Over 12%, from the plasticity of the fines alone. Between the two it comes from both, and the result is a dual symbol.
- Second letter, coarse soils. From gradation: a gravel is W when Cu ≥ 4 and 1 ≤ Cc ≤ 3; a sand needs Cu ≥ 6 with the same Cc window. Fail either and it is P. From plasticity: fines above the A-line make it C, below make it M.
- Fine-grained soils. Liquid limit under 50 gives L, 50 or over gives H. Above the A-line gives C, below gives M. Organic soils take O, identified not from the chart but by testing the liquid limit twice, as received and after oven drying: a ratio below 0.75 means organic.
The 50% at step 1 is not the same 50% as step 2
Step 1 compares fines against the whole sample. Step 2 compares gravel against sand within the coarse fraction only, after the fines are set aside. Applying step 2 to whole-sample percentages is the commonest slip in the procedure, and it silently converts sands into gravels.
What the plasticity chart decides
The letters C and M, and L and H, are all settled on the Casagrande plasticity chart. It plots liquid limit against plasticity index — PI = LL − PL — and is divided by three lines.
- The A-line, PI = 0.73(LL − 20), separates clays above from silts and organic soils below. It is not a law of nature but an empirical boundary Casagrande drew through a large body of test data in the 1940s, and it has held up.
- The U-line, PI = 0.9(LL − 8), is a practical upper bound on real soils. A point above it almost always means a testing error, and should send you back to the laboratory rather than into a report.
- The LL = 50 divider splits low plasticity from high. A specimen at LL 49 versus LL 51 changes its second letter on a two-unit difference in a test with real repeatability limits — which is why borderline results get dual symbols.
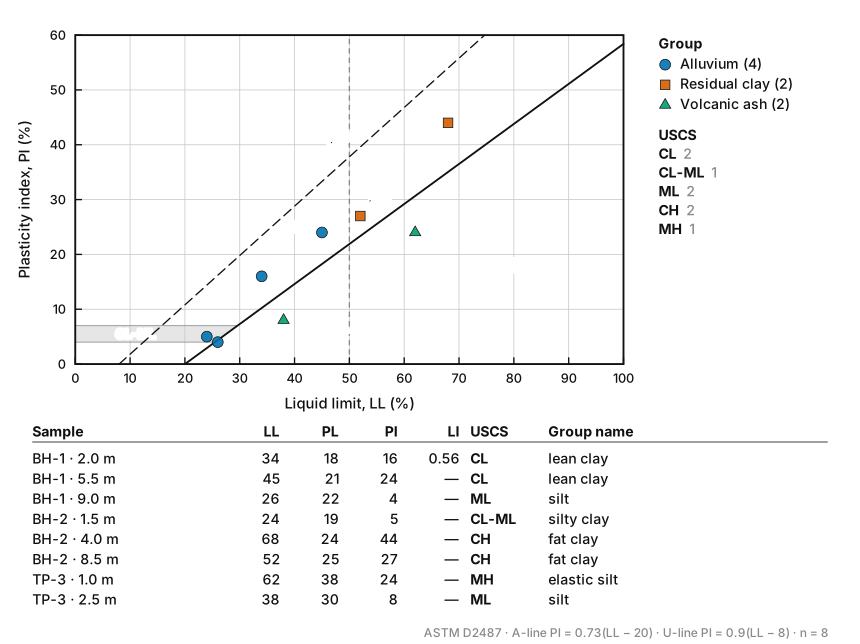
That last case is worth dwelling on. TP-3 · 1.0 m has a liquid limit of 62 and a plastic limit of 38, so PI = 24. The A-line at LL 62 sits at 0.73 × (62 − 20) = 30.7, and 24 is below it. High liquid limit, but below the A-line: it is MH, an elastic silt, not a clay. Judging it on liquid limit alone — as a field description often does — would have called it a fat clay and predicted the wrong shrink–swell behaviour.
Dual symbols, and the three different things they mean
A dual symbol is not a hedge. It is a specific statement that the soil sits in a defined borderline zone, and there are three distinct zones that produce one.
- 5 to 12% fines in a coarse soil — written with a hyphen, as SW-SM, SP-SC, GW-GC. There are enough fines to influence behaviour but not enough to control it, so the symbol carries both the gradation letter and the plasticity letter.
- The CL-ML band — the small hatched zone on the plasticity chart between PI 4 and PI 7, above the A-line. Precision in this corner is beyond what the tests can deliver, so the standard declines to choose and says so.
- A genuine borderline case — written with a slash, as CL/CH or SC/CL. This one is a judgement call, used when a result sits so close to a boundary that the engineer wants both possibilities on the record. It is invoked deliberately rather than triggered by a threshold, and should be explained in the log.
Symbol and name are two different things
ASTM D2487 pairs every group symbol with a group name carrying the secondary fraction: SP is "poorly graded sand", but the same soil with 20% gravel is "poorly graded sand with gravel". The symbol classifies, the name describes, and a log should carry both — the name is what stops a reader imagining a cleaner material than came out of the hole.
Three specimens carried through
The same three sieve analyses, run through the path from the top.
BH-1 · 1.5 m. Fines 4%, so coarse-grained. Of the coarse fraction, gravel is 53% against sand 43%, so G. Under 5% fines, so gradation decides: D₁₀ = 0.22 mm, D₃₀ = 1.75 mm, D₆₀ = 9.5 mm, giving Cu = 43.2 and Cc = 1.46. A gravel needs Cu ≥ 4 and Cc between 1 and 3; both pass comfortably. GW — well-graded gravel with sand.
BH-2 · 4.0 m. Fines 3%, coarse-grained, with no gravel at all and 97% sand, so S. Gradation again decides: D₁₀ = 0.13 mm, D₃₀ = 0.19 mm, D₆₀ = 0.27 mm, giving Cu = 2.11 against a requirement of 6. It fails on uniformity alone. SP — poorly graded sand, the classic one-size dune or beach sand.
TP-3 · 0.9 m. Fines 28%, still under 50%, so coarse-grained; sand 70% against gravel 2%, so S. Fines are over 12%, so gradation is irrelevant and the plasticity of the fines decides. LL = 26, PL = 23, so PI = 3. The A-line at LL 26 is 0.73 × (26 − 20) = 4.38, and PI 3 is below it — and below PI 4, so not even the CL-ML band applies. The fines are ML. SM — silty sand.
That third specimen also shows what happens at the edge of the data. With 28% passing the No. 200 sieve the curve never reaches 10% passing, so D₁₀ cannot be read — and Cu and Cc with it. They are not determinable rather than extrapolated, and it does not matter: at 28% fines the classification never needed them.
What the symbol does not tell you
The USCS classifies a remoulded soil from index tests. It says nothing about in-situ density, structure, cementation or stress history, and those routinely matter more than the symbol: a dense, over-consolidated CL is a competent founding stratum, while a soft, normally consolidated CL with identical index properties is not.
It is also not the only system in use. AASHTO, built for highway subgrades, groups soils differently and will not agree. BS 5930 uses the same A-line but subdivides the liquid limit into five bands — L, I, H, V, E — so an ASTM CH may be CV or CE under the British system. Always name the scheme alongside the symbol.
Keep reading
- Reading a Grain Size Distribution Curve
How to read D10, D30 and D60 off a particle size distribution curve, calculate Cu and Cc with worked numbers, and tell a well-graded soil from a poorly graded one.
- How to Read a Piper Diagram
The three panels of a Piper trilinear diagram explained, why concentrations must be converted to milliequivalent percentages, and a worked example classifying a real analysis.